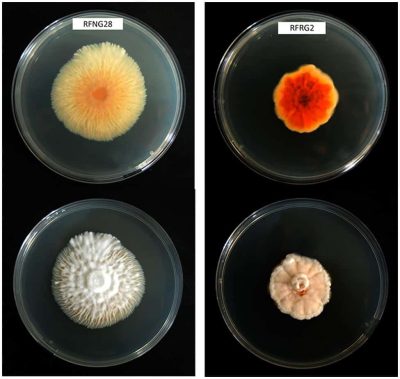
This project reproduces the study carried out by Hittalmani S. et al. in 2016 about the S. oryzae fungus, which causes sheath rot of rice. We used OmicsBox for all necessary steps till functional analysis in order to predict pathogenic functions.
(Original research paper: https://doi.org/10.1186/s12864-016-2599-0)
1. Introduction
Sheath rot disease caused by S. oryzae is an emerging threat to rice cultivation. This fungus invades rice through stomata and wounds caused by insects. Upon infection, the fungus engenders necrotic lesions at the mesophyll and vascular tissues, which impede the adequate translocation of nutrients from the foliage to the panicle. This leads to the production of partially filled chaffy grains, affecting the production yield by up to 85%. Nonetheless, despite the threat this fungus entails, little is known about its life cycle and infection biology.
Thereby, as an attempt to attain information about putative genes involved in pathogenicity, Hittalmani S. et al. carried out a de novo genome assembly and annotation of S. oryzae. The goal was to create genomic resources, which could be translated into designing better disease management strategies and widen the understanding of rice-Sarocladium pathosystem.
2. Preprocessing of raw reads
First, we downloaded the raw reads from the NCBI SRA database (accession number: SRX1639538) using the SRAtoolkit. Since it was a paired-end library, reads were available in two different fastq files (SRR3233859_1 for one end, and SRR3233859_2 for the other). Read length is 151bp for both ends and fragment size ranged from 400 to 600 bp.
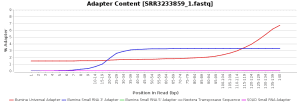
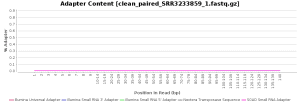
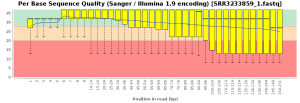
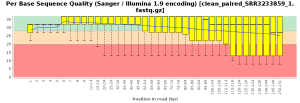
The quality control of the FastQ files was performed with OmicsBox (in General Tools > FastQ Tools > FastQ Quality Check). In overall, results show reads with good quality. However, there is a small number of reads with low mean quality and adapter contamination. Therefore, processing was performed to remove adapter contamination and filter low-quality reads (those with less than 23 Phred Score) and reads with less than 36 pb long, as they are considered to be uninformative (in General Tools > FastQ Tools > FastQ Preprocessing). Figures below show the adapter content and the per base sequence quality before and after the cleaning of SRR3233859_1.fastq. Results for SRR3233859_2.fastq are not shown because they are very similar.
| Adapter sequence contaminants | |
| Before processing | After processing |
 |
 |
| Phred score quality | |
| Before Preprocessing | After Preprocessing |
 |
 |
3. Genome Assembly and Gene Finding
Once we have obtained good quality reads, the assembly is performed using SPAdes (v. 3.13.1) assembler with OmicsBox (in Genome Analysis > DNA-seq de Novo Assembly) leaving k-mer sizes and read coverage cutoff in automatic. Total genome size was about 32.3 Mpb, with 3443 scaffolds and a N50 of 21403.
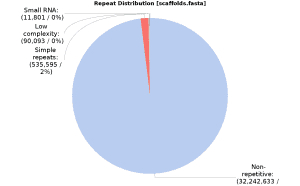
Previous to gene prediction, it is highly recommendable to do a repeat masking. This step is missing in the original paper so we did gene prediction in both sequences with and without masking to compare results. The masking was done using the OmicsBox functionality (in Genome Analysis > Repeat Masking) based on RepeatMasker (v. 4.0.9), with RMBLast search engine against RepBase (release 20181026) and default Dfam (v. 3.0) databases and using Sarocladium zeae as a closely related species. After processing 637147 bp were masked, which corresponds to 1.94% of total genome size; 0.04% of small RNA, 0.27% of low complexity repeats and 1.63% of simple repeats. The above pie chart shows the repeat distribution:
Ab initio gene finding was performed for both datasets (with and without masking) using Augustus (v. 3.2.2) in OmicsBox (in Genome Analysis > Eukaryotic GeneFinding). In order to predict genes more accurately Fusarium graminearum was stated as a closely related species, considering that codon usage bias might be very similar between them. Complete genes were searched in both strands and the generated output was a protein fasta. A total of 10256 and 10331 genes were predicted in the dataset with and without repeat masking, respectively. In this case the difference is not very large due to the low repeat content of this genome. The dataset used in the following steps is the masked one with a total of 10256 putative proteins.
4. Functional annotation
Functional analysis of the obtained genes was carried out in OmicsBox following this steps:
- CloudBlast (in Functional Analysis > Blast > Run Blast): blastp (with default options) of proteins predicted in the previous step against SwissProt database, to find already characterized proteins similar to our query.
- Mapping (in Functional Analysis > Blast2GO Mapping > Run GO Mapping): retrieve GO terms associated with the Hits obtained by the BLAST search.
- Annotation (in Functional Analysis > Blast2GO Annotation > Run Annotation): select from the pool of GO terms those which are the most specific with a certain level of reliability. Annotation was made with default parameters.
- InterProScan (in Functional Analysis > InterProScan > Run InterPro): retrieve domain/motif information about predicted proteins and annotate GO terms relative to them. The search was done against default databases. This step aims to add more information to the BLAST search.
- Merging (in Functional Analysis > InterProScan > Merge InterProScan GOs to Annotation) of GO terms retrieved with InterProScan with previously annotated ones. This process was done with default parameters.
The above figure shows the results of the annotation: 70.4% of the total predicted proteins were successfully annotated, whereas 5.34% had GO terms mapped but they did not pass the annotation filter, 0.36% had BLAST hits but they did not have any GO term associated and 23.9% did not have any BLAST hit (no similar proteins were found):
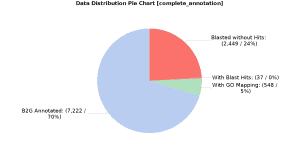
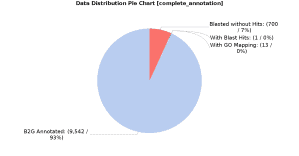
In order to add more information, we also searched for orthologues against the EggNOG database using EggNOG-mapper in OmicsBox (in Functional Analysis > EggNOG Annotation > EggNOG mapper). The search was made for all types of orthologs and only GO terms with experimental evidence were annotated. Once the EggNOG-bases annotation was finished, the results were merged with the previous annotation (in Functional Analysis > EggNOG Annotation > Merge EggNOG 5 GO Annotations) leaving all parameters by default. As a result, the total amount of annotated sequences increased significantly (from 70% to 93%), as can be seen in the above figure:
5. Search of pathogenicity genes
Once the annotation of genes was finished, we proceeded with the identification of genes potentially involved in the pathogenicity of S. oryzae.
To identify putative genes involved in pathogenicity, S. oryzae proteomes were analysed for pathogen-host interaction (PHI) genes, secretory proteins, carbohydrate-active enzymes (CAZymes) and secondary metabolites biosynthetic genes that are required to colonize the host tissue. In order to do so, we performed a bastp of previously predicted gene sequences against an appropriate database, so we can made an enrichment analysis with retrieved sequences.
5.1 Putative Pathogen-Host Interaction (PHI) Genes
First, the Pathogen-Host interaction database (PHI-base) was downloaded from its webpage (http://www.phi-base.org/). In order to do the blastp, it is needed to build a formatted database for OmicsBox (in Functional Analysis > Blast > Make Blast Database). With the database, we performed a local blastp against it (in Functional Analysis > Blast > Run Blast) using the predicted gene sequences in gene finding step. By doing this, we only obtain which sequences have hits against PHI-base, but we don’t have functional information about these sequences. However, we had all predicted sequences annotated in the previous step, so we only had to search those sequences with hits in the complete annotation to know their functionality.
To do so, we selected sequences with blast hits against PHI-base filtering them by the tag “blasted” in Tags column. In order to filter quality hits, we first retrieved information about the top hit for each sequence (in File > Export > Generic Export: sequence name, blast top hit e-value, blast top hit similarity and blast top hit HSP/Query) and save it into a comma separated values (csv) file. Then, we filtered sequences with more than 40% of similarity and 70% of query coverage using a python script written for that purpose. Once filtered, we stored the sequences names on a txt file; 2,538 in total. So, at this point, we had in a file the sequence names of those that had produced quality blast results against the PHI-base.
Then, back into the functional annotation project we performed an enrichment analysis to see which functions were enriched on those saved sequences compared to all dataset (in Functional analysis > Enrichment Analysis > Enrichment Analysis (Fisher’s Exact Test)), using the file with sequences names that had hit against PHI-base as Test-Set Files and leaving the Reference-Set Files unchecked (so the whole annotated dataset is used as reference) and with a FDR cutoff of 0.05. Results can be easily visualized with a Word Cloud chart (on the side Toolbar > Open as > WordCloud):
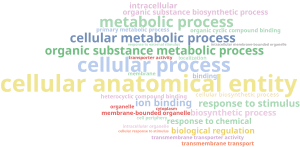
This results were too general, so we reduced the list of GOs to the most specific (in side Toolbar > Actions > Reduce to Most Specific) and built the Word Cloud again in the new project tab opened:
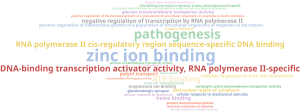
It shows that the pathogenesis term in general was significantly represented in our sequences. In particular, the zinc ion binding is strongly represented. Pathogen and host compete for zinc during infection (as it is a widely used cofactor for many proteins) so it is usual that pathogens produce high-affinity zinc binding proteins.
5.2. Secretome analysis
First, an InterProScan was performed against databases with information about signal and transmembrane proteins (in Functional analysis > InterProScan > Run InterPro > EMBL-EBI InterPro cheking Phobius, SignalPHMM and TMHHM databases and leaving the rest unchecked). Once finished, we obtained sequences with InterPro IDs associated (mainly “transmembrane”, “cytoplasmic domain” and “TMhelix”) but any of them with GO terms, so we perform a procedure similar to the previous step.
First we selected sequences with InterPro hits by the tag “interpro” in Tags column and save its names into a file (right-click on one sequence name > Create ID List of Column: SeqName > Save As…). As the InterProScan does not calculate the similarity nor the coverage, we selected the retrieved sequences on the complete annotation project (in Functional Analysis > Tools (Select, Rename, Search) > Select > Select Sequences > File) and export all information from here (in File > Export > Generic Export, selecting sequence name, blast top hit e-value, blast top hit similarity and blast top hit HSP/Query) so we could made the quality filter in the same way than in PHI analysis (more than 40% similarity and 70% query coverage). At this point, we had in a file the names of those sequences with transmembrane or signal domains (information retrieved by the InterProScan) that also had quality blast hits (as the functional enrichment will be made with the annotation from this blast project).
Then, back into the functional annotation project we performed an enrichment analysis following the same procedure as in the pathogenicity analysis. As before, results can be easily interpret with a Word Cloud chart:
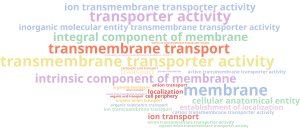
As expected, it shows GO terms associated with the membrane. But this results are too general to be informative, so we reduced the list of GOs to the most specific as before and obtain the following Word Cloud:
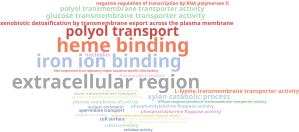
As we can see, the term “extracellular region” is enriched, meaning that there could be extracellular proteins responsible of interacting with the host. In particular, “iron ion binding” and “heme binding” are also enriched and it has been demonstrated in other fungal species that this is a pathogenic mechanism, as the fungi competes for the iron with the host and in some cases it even utilizes the iron present in the hemoglobin’s host. In addition, it is enriched in “polyol transport” which can be related to a pathogenic mechanism as well, since some pathogenic fungal species use polyols as mannitol to stifle ROS-mediated plant resistence.
5.3. Analysis of Carbohydrate-Active Enzymes (CAZymes)
To analyse the presence of CAZymes genes and whether there is an enriched function, we performed an analysis similar to the section 5.1. First, we downloaded the CAZy database from its repository (http://bcb.unl.edu/dbCAN2/download/) and prepare the database for its use in OmicsBox, using the Make Blast Database tool. With the database, we performed a local blastp against it using the predicted gene sequences in gene finding step and filter those sequences with more than 40% of similarity and 70% of query coverage. Finally, we carried out an enrichment analysis to see which functions were more represented in those retrieved sequences compared to the entire dataset. The above word cloud chart shows in a readable way the results of the enrichment analysis:

This shows enriched terms associated with hydrolysis but, as happened in previous steps, this terms are too general so we reduced the list of GOs to the most specific as well:
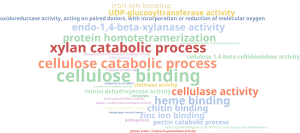
Here we can see that S. oryzae presents enzymes to degrade plant cell wall components like cellulose and xylan, which is an important step during infection. This cell degrading mechanism could be the cause of the rot produced by this fungus. There is also present terms previously retrieved about metal ion binding like iron, heme and zinc.
5.4. Secondary metabolite production: analysis of biosynthetic pathways
It has been demonstrated that secondary metabolites are essential for fungal growth and development. Secondary metabolites provide protection against several environmental stresses, hence implying an advantage to bear possible hard conditions engendered by the plant being infected.
Furthermore, it has been suggested that a concomitant production of helvolic acid and cerulenin might have a synergistic effect to invade the host by changing the cell permeability, leading to leakage of electrolytes in the host tissue. Taking advantage of the information available in the Gene Ontology Consortium webpage, we compiled the GO terms associated with genes involved in the biosynthesis of these secondary metabolites: nonribosomal peptide synthases, polyketide synthases, prenyltransferases and terpene cyclases. Then, these GO terms were searched in Blast2GO. All of them were found in the annotated project.
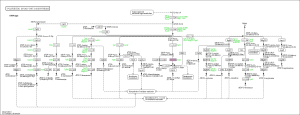
Moreover, we also used the KEGG pathway database to search possible pathways in our organism implicated in secondary metabolite biosynthesis using with OmicsBox (in Functional analysis > Pathway analysis > Load KEGG Pathways). Interesting pathways were found: polyketide sugar unit biosynthesis, biosynthesis of terpenoids and steroids, antibiotics biosynthesis, drug metabolism, glycan degradation and peptidoglycan biosynthesis. As example, the following figure shows the polyketide sugar unit biosynthesis pathway:
6. Prediction of repeats
As a fungal species, repetitive DNA is an integral part of S. oryzae genome. It is important to study repetitive DNA sequences types present in its genome since they generate genetic diversity and lead to genome expansion.
The prediction of repetitive sites can be done using RepeatMasker. We had already done this in section 3 using the Repeat Masking utility available in OmicsBox (in Genome Analysis > Repeat Masking) and the results showed that S. oryzae genome has a low content of repetitive sites.
7. Conclusions
- Quality check and processing of raw reads was carried out with OmicsBox.
- Genome assembly of processed reads was carried out with OmicsBox.
- Gene finding and functional annotation of those predicted sequences were successfully performed using the utilities available in OmicsBox.
- The Fisher’s Exact Test performed in OmicsBox enabled the identification of enriched functions in gene-sets like pathogenicity-related genes, genes that form part of the cell secretome or genes that codify for hydrolytic enzymes. This analysis give us an idea of the pathogenic mechanisms of S. oryzae.
- Results retrieved from the KEGG pathway tool in OmicsBox reinforce the conclusions indicated in the original research regarding the capacity of S. oryzae to synthesize secondary metabolites involved in the acclimatization to environmental conditions, a mechanism which represents a survival advantage for S. oryzae.
- Repetitive content analysis was performed using OmicsBox.
- Results obtained are consistent with the ones on the original paper, which demonstrates the robustness of the used analysis pipeline and tools.
8. References
- Hittalmani S, Mahesh HB, Mahadevaiah C, Prasannakumar MK (2016) De novo genome assembly and annotation of rice sheath rot fungus Sarocladium oryzae reveals genes involved in Helvolic acid and cerulenin biosynthesis pathways. BMC Genomics 17:271.
- Götz S, et al.. (2008) High throughput functional annotation and data mining with the Blast2GO suite. Nucleic Acids Research, vol 36, pp. 3420-3435.
- Andrews S (2010) FastQC: a quality control tool for high throughput sequence database
- Bolger AM, Lohse M, Usadel B (2014) Trimmomatic. Aflexible trimmmer for Illumina Sequence data. Bioinformatics, btu170.
- Smit AFA, Hubley R & Green P(2013-2015) RepeatMasker Open-4.0.
- Kanehisa M, Goto S (2000) KEGG: kyoto encyclopedia of genes and genomes. Nucleic Acids Research 28(1):27-30.
- Ashburneret al. (2000) Gene ontology: tool for the unification of biology. Nat Genet 25(1):25-9.
- GO Consortium (2017) Nucleic Acids Research.
- Bankevich A, et al. (2012) SPAdes: a new genome assembly algorithm and its applications to single-cell sequencing. Journal of computational Biology.
- Mario Stanke and Stephan Waack (2003), Gene Prediction with a Hidden-Markov Model and a new Intron Submodel. Bioinformatics, vol 19 suppl 2, pages 215-225.
- Huerta-Cepas J (2016) eggNOG 4.5: a hierarchical orthology framework with improved functional annotations for eukaryotic, prokaryotic and viral sequences. Nucleic Acids Research 44 (D1):D286-D293.
- Winnenburg R, et al. (2006), PHI-base: a new database for pathogen host interactions. Nucleic Acids Research 1:34:D459-D464.
- Moller S, Croning MDR, Apweiler R (2001). Evaluation of methods for the prediction of membrane spanning regions. Bioinformatics 17(7):646-653.
- Robert Hubley et al. (2016). The Dfam database of repetitive DNA families. Nucleic Acids Research 44:D81-89.
- Bao W, et al (2015). Repbase Update, a database of repetitive elements in eukaryotic genomes. Mob DNA 6:11.
- Cerasi, M., Ammendola, S. and Battistoni, A., 2013. Competition for zinc binding in the host-pathogen interaction. Frontiers in Cellular and Infection Microbiology, 3.
- Meena, M., Prasad, V., Zehra, A., Gupta, V. and Upadhyay, R., 2015. Mannitol metabolism during pathogenic fungal–host interactions under stressed conditions. Frontiers in Microbiology, 6.
- Kuznets, G., Vigonsky, E., Weissman, Z., Lalli, D., Gildor, T., Kauffman, S., Turano, P., Becker, J., Lewinson, O. and Kornitzer, D., 2014. A Relay Network of Extracellular Heme-Binding Proteins Drives C. albicans Iron Acquisition from Hemoglobin. PLoS Pathogens, 10(10), p.e1004407.
- Kubicek, C., Starr, T. and Glass, N., 2014. Plant Cell Wall–Degrading Enzymes and Their Secretion in Plant-Pathogenic Fungi. Annual Review of Phytopathology, 52(1), pp.427-451.
- Zhao, Z., Liu, H., Wang, C. and Xu, J., 2014. Correction: Comparative analysis of fungal genomes reveals different plant cell wall degrading capacity in fungi. BMC Genomics, 15(1), p.6.
