Analysis workflow
-
- Objective: To describe the process of a transcriptome characterization using Blast2GO.
-
- Input data: A mouse RNA-seq dataset composed of 140803 contigs.
- Pipeline:
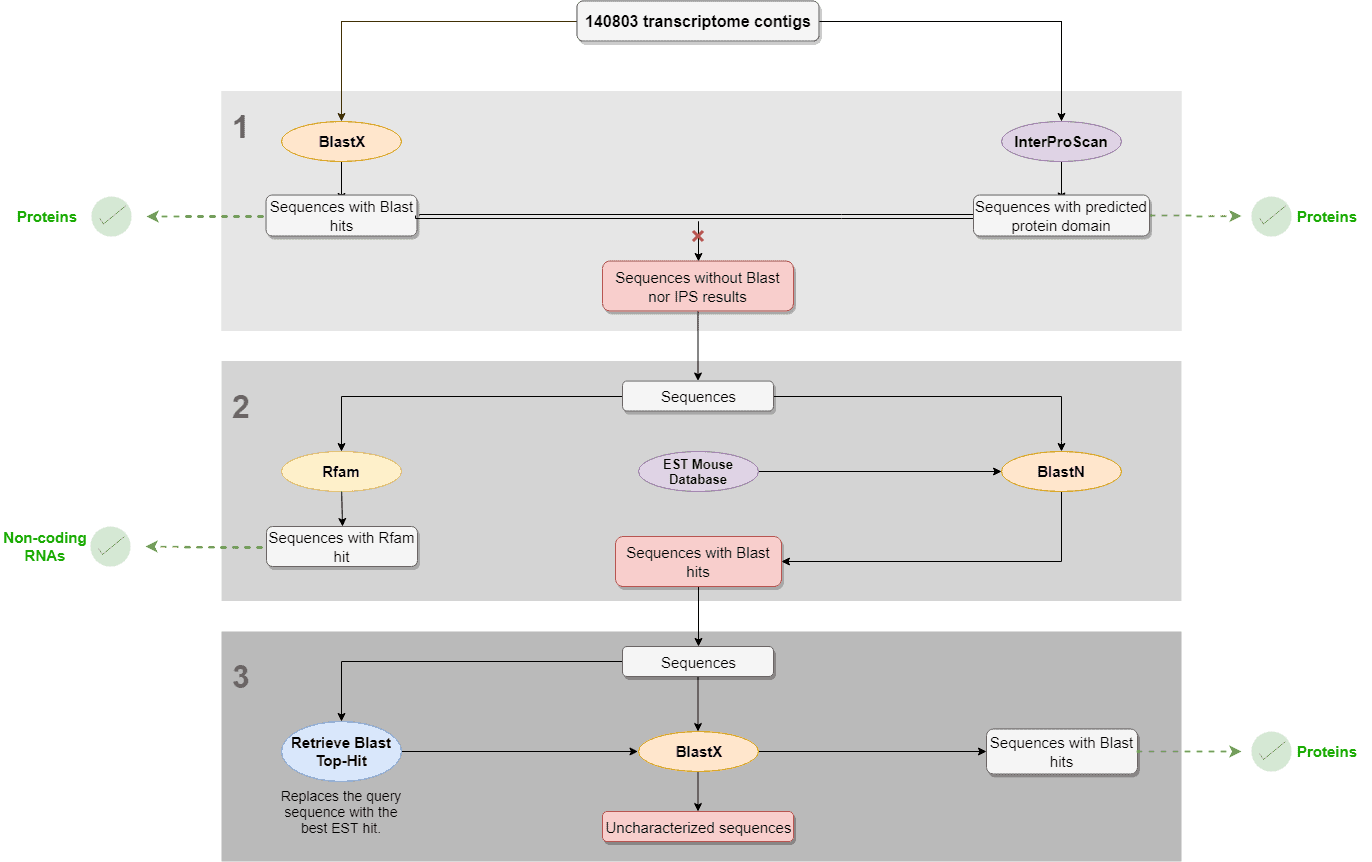
- Blastx and InterproScan were performed with the complete dataset to identify proteins. Sequences with no Blastx hits nor IPS results were selected and further analyzed.
- RFAM and Local Blast (against an EST mouse db) were performed with the sequences with no Blastx nor IPS result in order to find structural and non-coding RNAs and ESTs, respectively.
- “Retrieve Blast Top-Hit” was used to replace the query sequences by the best EST hit sequences obtained in the local Blast result. Then, Blastx was performed using EST hits as queries in order to find new protein matches.
- In the results, we show how many of the contigs were characterized as proteins or structural RNAs in each of the above-mentioned steps.
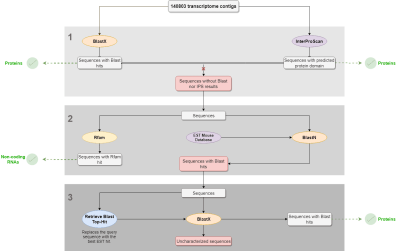
Figure 1. Transcriptome characterization workflow.
Data-set
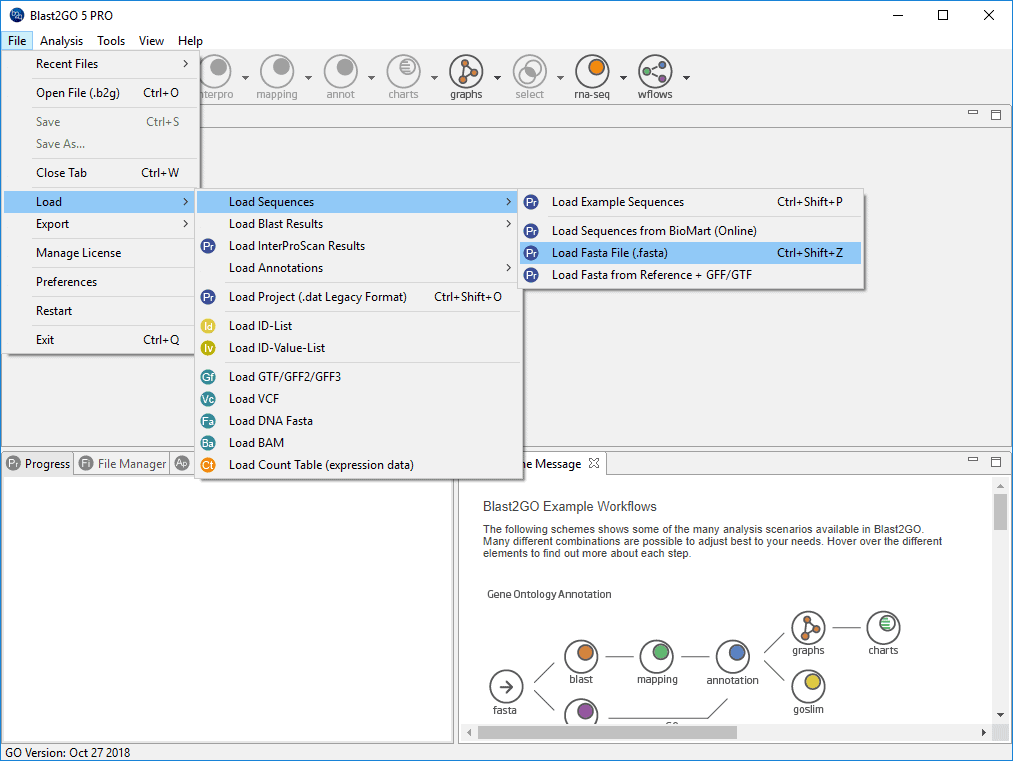
The input loaded into Blast2GO is a fasta file which contains 140.803 mouse contigs, obtained from an RNA-seq Mus musculus (Taxonomy ID 10090) experiment (GEO accession). The figure on the right shows how to load this fasta file in Blast2GO.
Figure 2. How to load a fasta file.
1. How to find protein matches (Blastx, InterProScan)
1.1 Blastx
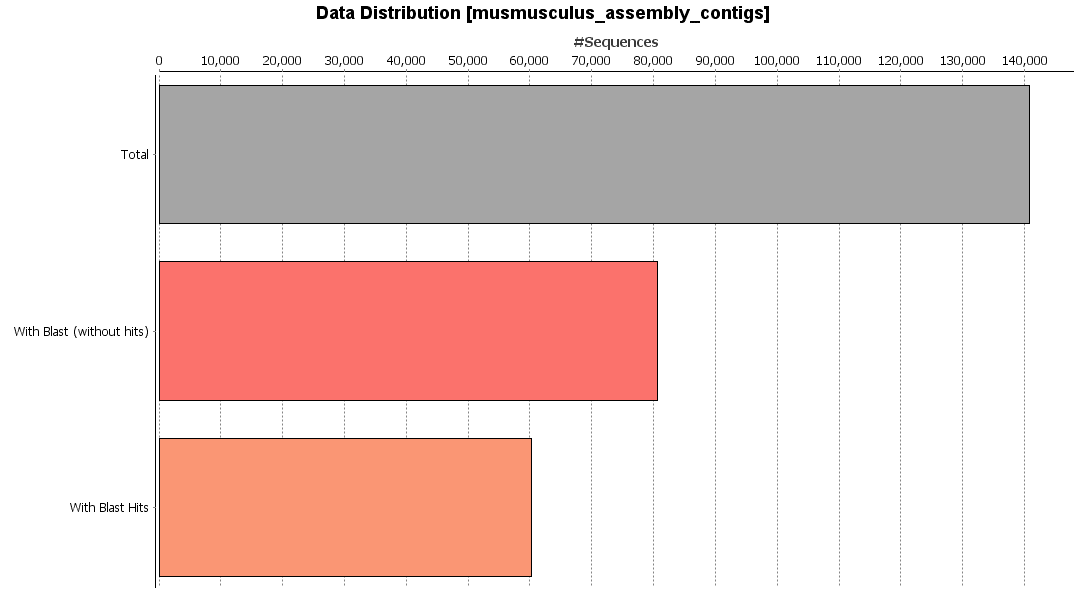
CloudBlast is a cloud-based, high-performance resource for high-throughput analysis that offers fast and reliable sequence alignments. In this example, CloudBlast (Blastx program) was performed against the mouse-specific subset of the non-redundant (NR) database using the default parameters. From the “Charts” menu, different statistics regarding the results can be generated. As an example, the data distribution chart is shown in the figure. This chart shows how many of the sequences have been blasted with hits, without hits or remain without analysis.
Sequences that find blastx matches will be defined as proteins. To functionally characterize them, mapping and annotation steps are needed.
Figure 3. BlastX results.
1.2 InterProScan
InterProScan (IPS) is a resource that provides a functional analysis of protein sequences by classifying them into families and predicting the presence of domains and important sites. InterProScan uses predictive models, known as signatures, provided by several different databases for the analysis. In this usecase, Cloud-IPS was performed with the complete dataset in order to find protein domains that may help characterize our contigs. Cloud-IPS is a Cloud-based resource for fast and reliable InterPro analysis which allows executing the original IPS algorithm in reduced time.
This analysis was performed using the default parameters and in parallel to the Blastx analysis. The domain types found the GO IDs and the protein accessions are retrieved, among other result types, in a result table (the figure on the right shows the InterProScan results of one sequence).
Figure 4. InterProScan results.
1.3 Select sequences with no Blastx hit nor IPS domain for further analysis
Sequences with Blastx hit or IPS domain can be classified as proteins. Sequences with neither one nor the other type of result, need further analysis to be characterized. To further analyse these sequences, we extracted them to a new project.
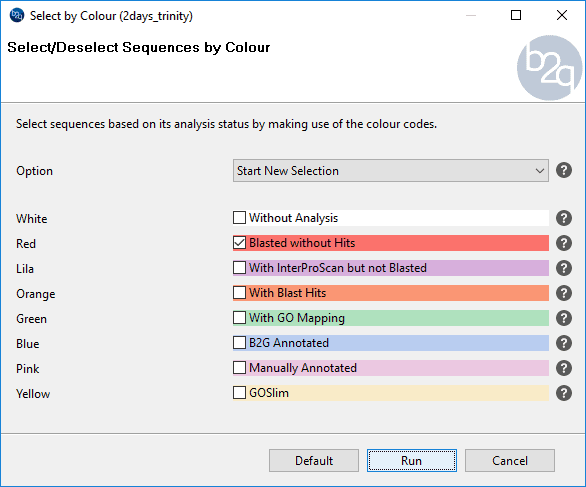
To extract sequences to a new project, we selected sequences with no Blastx hit (red sequences) using the “Select by colour” tool from the “Select” menu.
Once selected, these sequences can be filtered using the “Selected” filter, and can be marked by Ctrl + A (Windows and Linux) or Apple + A (Mac). We extracted them using the “Extract selection to New Tab” option in the context menu.
Figure 5. How to select sequences by colour.
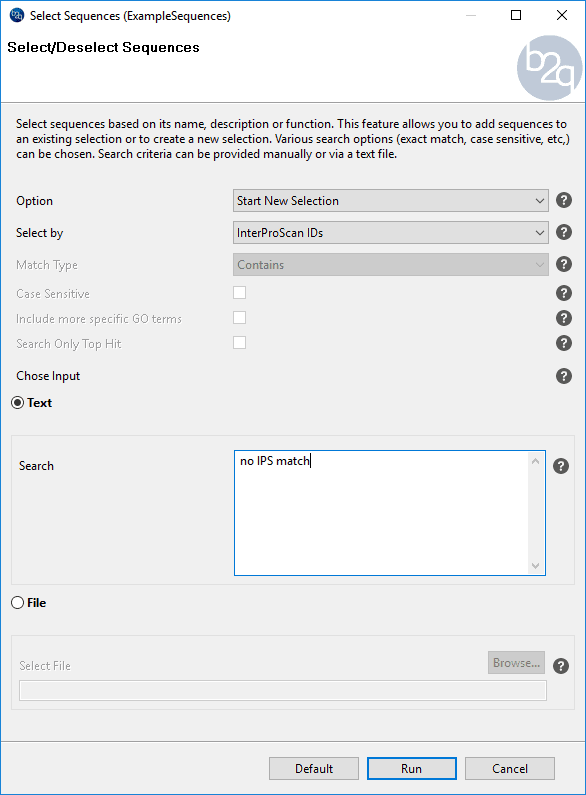
From the new project (sequences without Blastx result), sequences without IPS result were selected using the “Select” menu and searching for sequences with “no IPS match” (Click on the image on the right for instructions on how to do this). After doing so, only sequences without blastx and without IPS were selected.
The following analysis (RFAM and local Blast) was performed only with these uncharacterized contigs, to reduce the computational time.
Figure 6. How to select sequences without IPS domain.
2. How to find non-coding RNAs and ESTs (Expressed Sequence Tags) (RFAM, Local Blastn)
2.1 RFAM
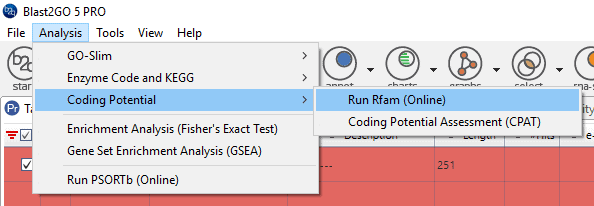
Blast2GO allows searching for non-coding RNA (ncRNA) families and other structured RNA elements sequences via the RFAM webservice. Rfam database is a collection of RNA families represented by multiple sequence alignments, consensus secondary structures and covariance models (Cms). RNA families are categorized into three functional classes: non-coding RNA genes, structured cis-regulatory elements and self-splicing RNAs (http://rfam.xfam.org/). To further characterize sequences with no similarity to any known proteins, RFAM was performed. The upper figure shows the instructions to run RFAM. In the lower figure, the RFAM result table is shown. Different kind of results is retrieved, as for example the biotype of the RNA (snRNA, rRNA, etc) or the GO annotations.
For a detailed tutorial on how to run RFAM and interpret its results please link to the next video.
Figure 7. How to run Rfam.
Figure 8. Contigs with Rfam results.
Figure 9. Rfam biotypes distribution.
2.2 Local BlastN against a custom EST database
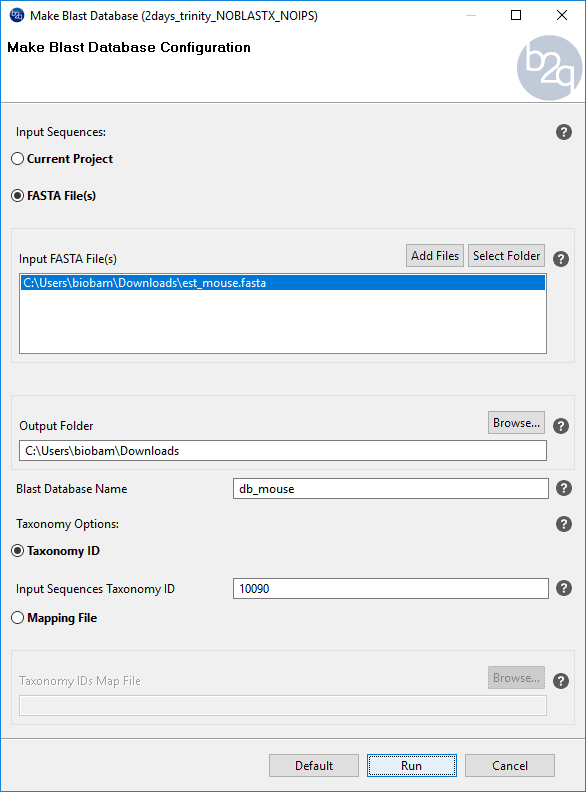
Blast2GO allows you to create your own Blast database from a single or multi-species FASTA file using the option “Make Blast Database”. Once the database is formatted, it can be used to run Blast locally. In this usecase, local Blast was performed against a custom EST mouse database. It is usual that RNA-seq data, due to its short length or low-quality sequencing, have difficulties in finding significant protein alignments. When this is the case, blasting against an EST database might be a good option as ESTs are sequences usually easier to match than proteins and which can later be used to find new protein matches (see step 3). The EST mouse database was generated in Blast2GO from an EST mouse fasta file downloaded from the NCBI FTP site.
For a detailed tutorial on how to create a custom database and run local Blast against it, please watch the following video.
Figure 10. How to create a custom database.
3. How to increase the number of sequences with protein matches (Retrieve Blast Top-Hits)
3.1 Retrieve Blast Top-Hits
The option “Retrieve Blast Top-Hit” is a Blast2GO feature which replaces the original query sequences with the top-hit found after a Blast search. In this usecase, we show how to use this tool to improve functional annotation by increasing the number of sequences with protein matches.
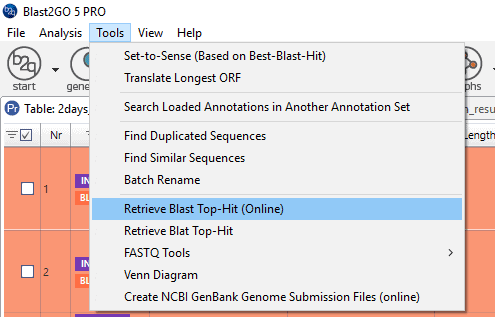
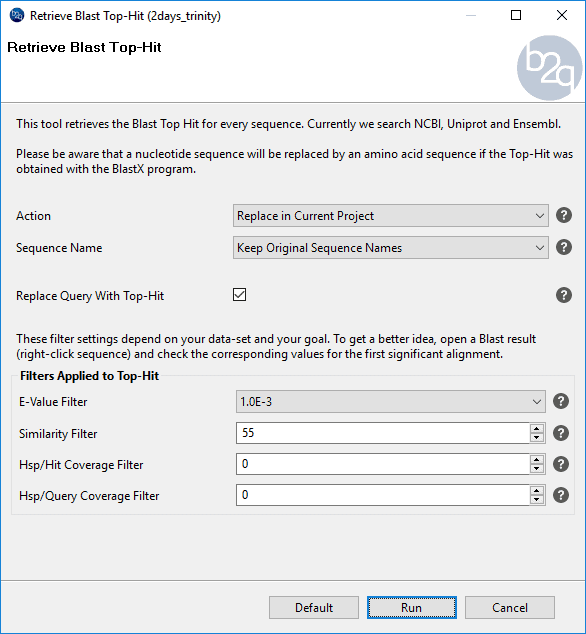
Some of the sequences that initially did not find protein hits (Blastx, step 1) found EST hits (Step 2). In this case, replacing the query sequences by the best EST hits and use this ESTs as queries in a Blastx search may help to find protein matches. To retrieve the sequences of the EST hits we performed “Retrieve Blast Top-Hit” (see the figure on the right for instructions). This tool allows to extract the top-hits to a new project or replace the sequences in the current project. Also, it allows choosing the sequence name (to keep the original names or to use the top hit IDs as name).
3.2 Blastx
Once the EST hits have been retrieved, we used them as queries in a Blastx search against the mouse subset of the nr database. As a result, we found significant protein alignments to nearly 40% of the uncharacterized sequences. These sequences could now be further mapped and annotated and thus, functionally characterized.
In this video tutorial, we explain in detail how to retrieve top EST hits to improve functional annotation.
Figure 11. Retrieve Blast Top-Hit menu.
Figure 12. How to configure Retrieve Blast Top-Hit.
Results
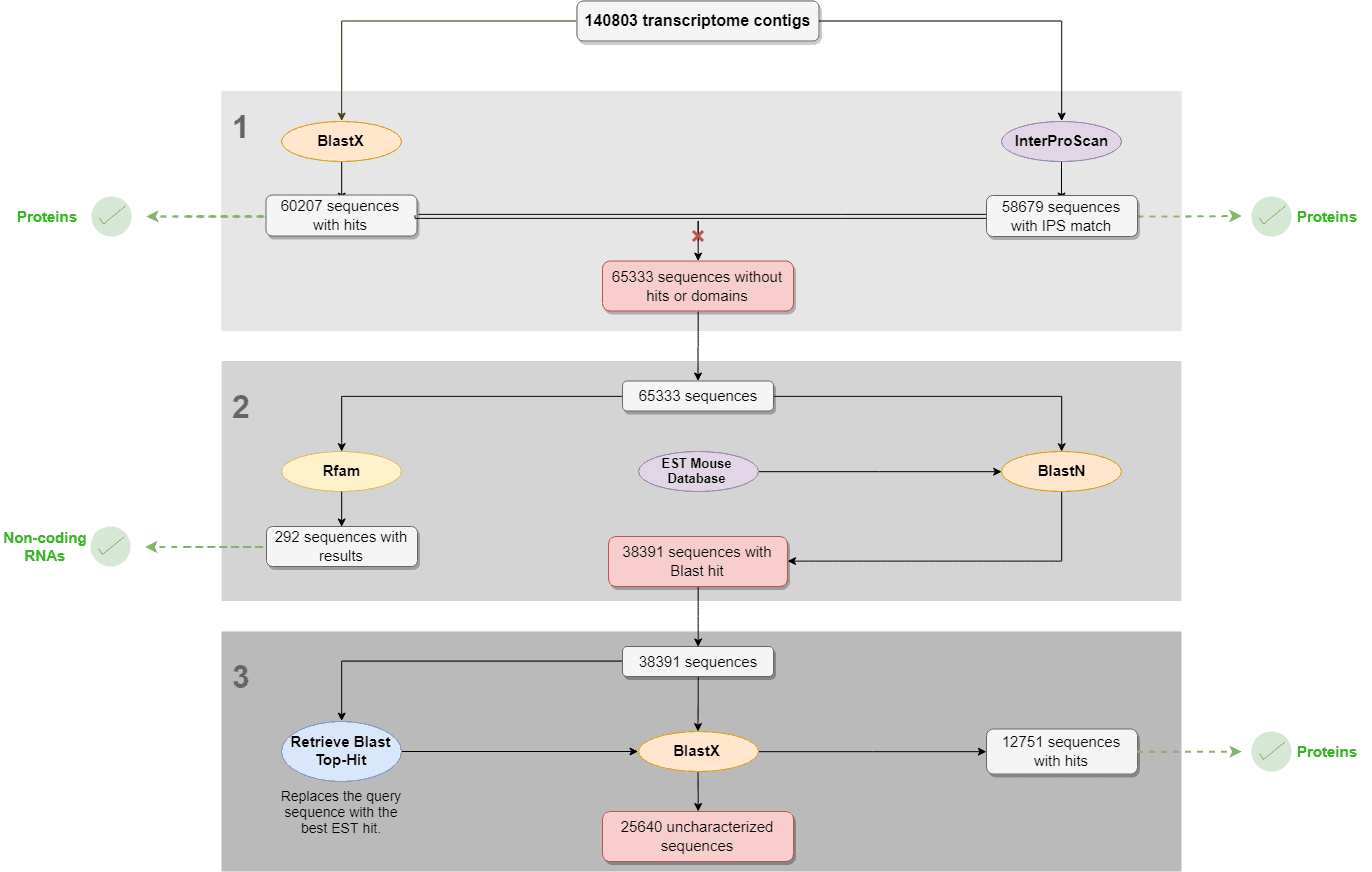
The number of contigs that have been characterized in each of the above-mentioned steps are shown in the scheme on the right.
By following this simple workflow, a total number of 114153 contigs (81.1 % of the complete dataset), could be characterized as proteins, ESTs, or non-coding RNAs. These results reveal the efficiency of Blast2GO regarding RNA-seq transcriptome characterization.
The remainder contigs (18.9%) are probably new transcripts that have not been characterized yet and thus, did not find any hit after the analysis.
Figure 13. Transcriptome characterization workflow with results.
To have a graphic representation of the number of characterized contigs, we combined the Blast, IPS and Rfam project in a unique project by using the “Merge” option, and we obtained the “Tag statistics” graph.
Figure 14. Final results.
For a tutorial on how to combine two projects in Blast2GO, please link to: How to combine two projects in Blast2GO?
