Single-cell transcriptomics has revolutionized the way we understand complex biological systems. By enabling researchers to study gene expression at the resolution of individual cells, it uncovers cellular heterogeneity, reveals intricate developmental pathways, and provides insights into disease mechanisms. However, as powerful as single-cell RNA sequencing (scRNA-Seq) is, translating its immense data into meaningful biological insights remains a great challenge.
One of the key steps in scRNA-Seq analysis is the accurate identification of cell types. Correctly identifying cell types is essential, but this process is not without challenges. One of the main difficulties is finding a comprehensive reference dataset to annotate the cells accurately. Researchers often face the tedious task of searching for suitable references, since the performance of the prediction depends on the similarity of the reference to our dataset in terms of experimental design. Ideally, a suitable reference should be from the same tissue, the same condition or state (e.g. same disease, treatment, etc.), the same tissue dissociation technique (some techniques favor certain cell types in front of others), etc. Moreover, we have to trust the curation and criteria followed by the authors of the annotated reference. Thus, it is recommended to perform the prediction with multiple references, perform a consensus, and further review and curate the obtained cell type predictions, which may be a laborious procedure.
To address these challenges, we are excited to introduce CellKb, a cutting-edge tool integrated into the latest version of OmicsBox. CellKb is an advanced tool that combines a robust cell-type prediction algorithm with an extensive knowledge base.
How Does CellKb Work?
The CellKb knowledge base contains thousands of manually curated references extracted from research papers. For each cell type identified, a ranked list of up-regulated genes—called a gene signature—is preserved and enriched with associated metadata. The same cell type may have multiple gene signatures derived from various experiments, reflecting diverse biological contexts.
The prediction algorithm compares a user-provided list of up-regulated genes against the curated signatures in the knowledge base. By evaluating the similarity between the query and these references, CellKb delivers precise and context-aware cell type predictions. This innovative approach leverages the collective power of diverse datasets, ensuring robust and reliable results.
What are the CellKb advantages?
- Leverages Multiple Datasets for Prediction: Instead of relying on a single reference, CellKb compares the query to each reference signature independently and integrates the comparison results from diverse datasets. This multi-dataset approach enhances prediction accuracy and ensures that annotations are robust and comprehensive.
- Eliminates the Need for External References: With CellKb, there is no need to search for and provide an external reference dataset. The tool comes equipped with a built-in knowledge base, having harmonized and standardized ontologies for tissues and cell types, that simplifies the annotation process and saves valuable time.
- Curated and Continuously Updated: The CellKb knowledge base is manually curated and is continuously updated to incorporate references from different species and tissues. Users are encouraged to contact BioBam or CellKb for suggestions.
CellKb implementation in OmicsBox
How to run it
After performing single-cell RNA-Seq clustering with Seurat’s implementation, just click on the “Cell Type Prediction” button right on the results Side Panel. This will open a window to select one of the two available options: SingleR or CellKb. Once CellKb is selected, the next pages will guide the user through further configuration.
The user only needs to select the cell groups to annotate—for instance, Seurat clusters in the example shown in Figure 1— and the filters to apply to the knowledge base. The query data will only be compared against the gene lists meeting the applied criteria, allowing for a more tailored and precise annotation. The only mandatory filter is the species to query against, whereas tissue(s), condition(s), and cell type(s) can optionally be specified as well. The filters to apply can be easily configured through the interactive window. The user can just start typing to see the available options and add them with a click.
Understanding the results
The primary output of CellKb is a set of predicted cell types. These new annotations are stored in the clustering object, which can be visualized in the interactive UMAP/tSNE viewer. As shown in Figure 2, this viewer allows users to color cells by various features, select them using different tools, and classify them into custom groups. CellKb provides two annotation levels: a “granular” annotation offering specific cell type terms and a “broad” annotation with more general terms. The granular annotation for a given group is assigned based on the top predicted cell type.
The reliability of these predictions can be evaluated using the summary reports (Figure 3). The main summary lists the broad and granular annotations for each group, along with the top candidate cell types, their prediction scores, and the overlapping canonical marker genes. This list shows known marker genes for a specific cell type that are also found in the differentially expressed genes (DEGs) for a given group. If no overlap exists or if no marker genes are available, the list will remain empty. It is important to note that CellKb always provides an annotation if at least one gene matches a reference gene list under the applied filters. The total number of reference gene lists used for prediction can also be found in the general summary.
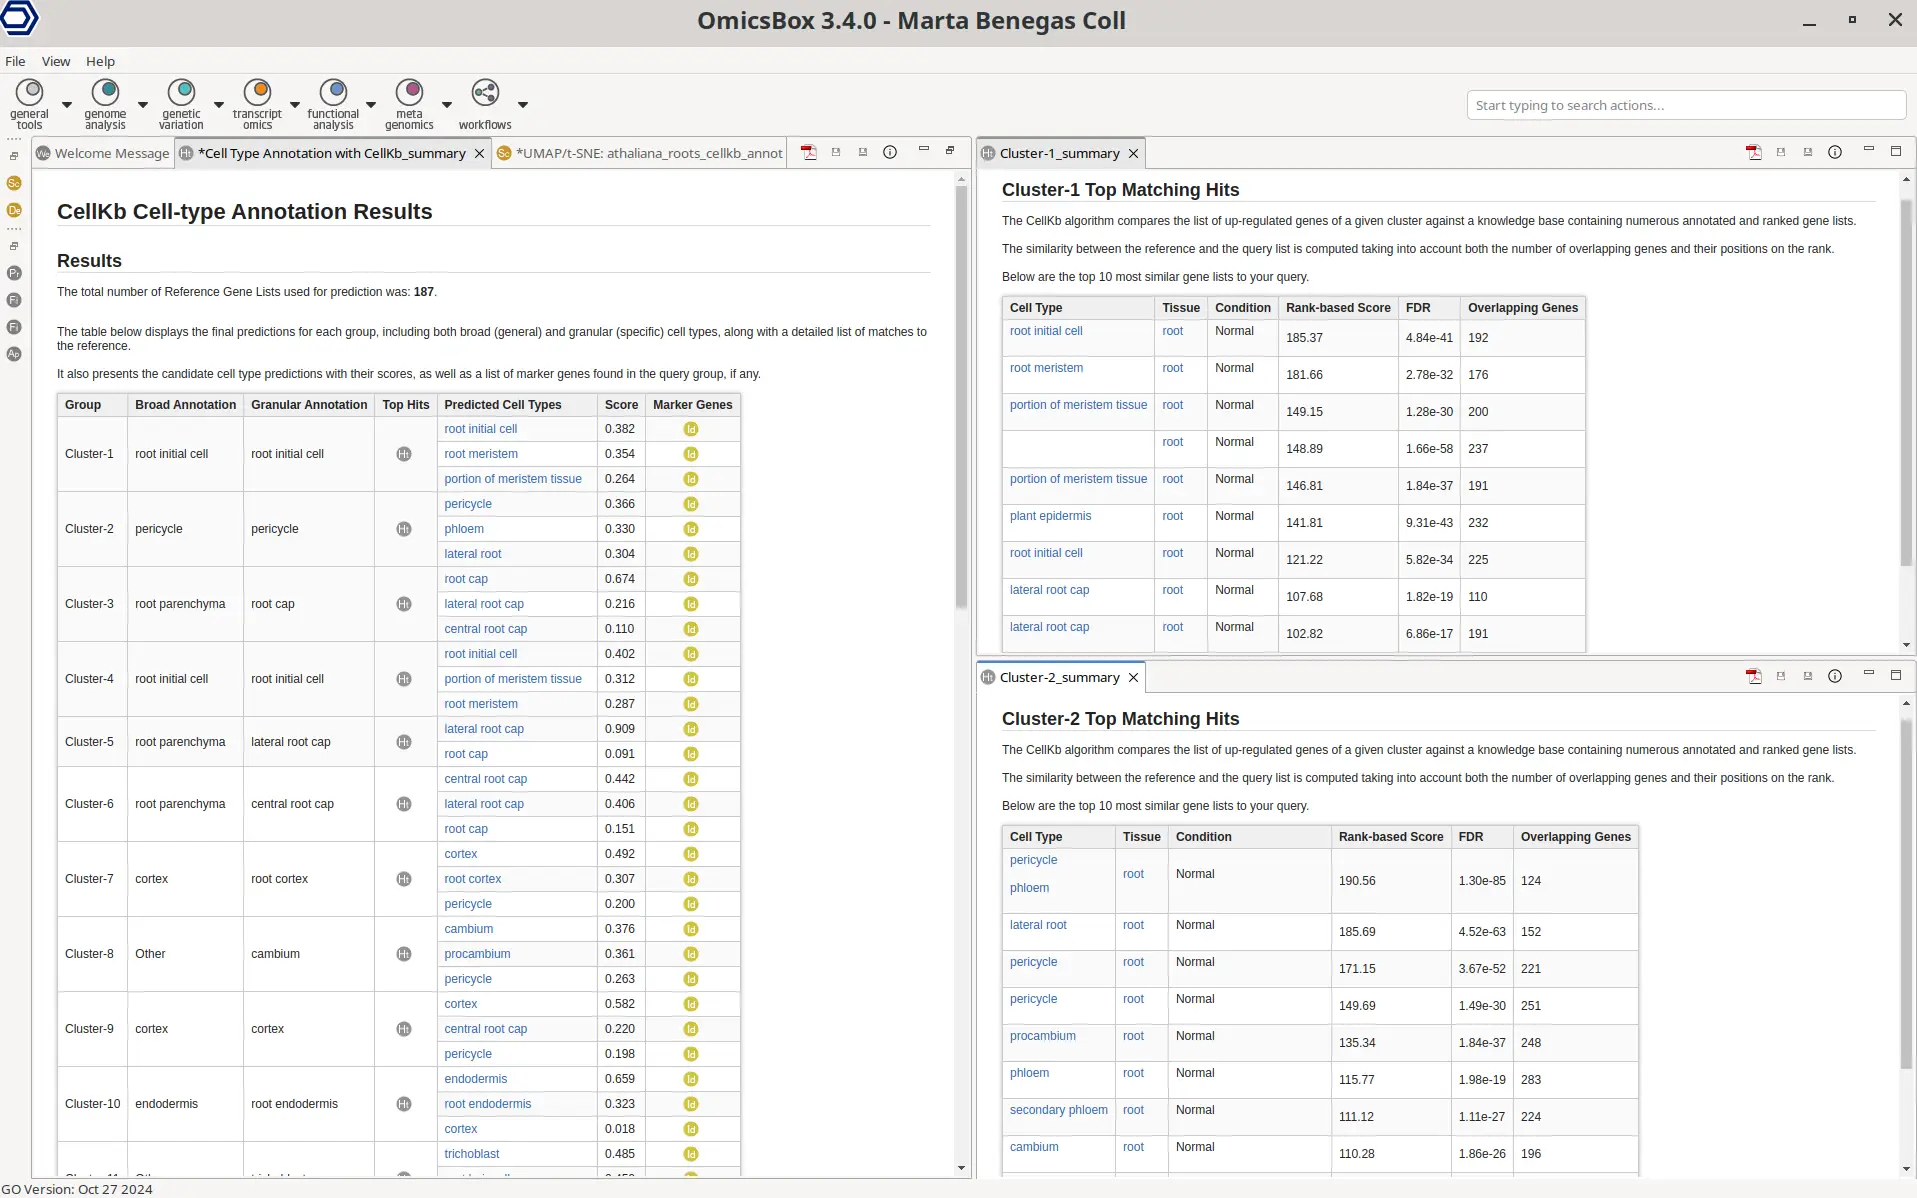
The prediction score for each candidate cell type is a relative measure, calculated by comparing the rank-based scores of top-matching references. A high prediction score indicates that the query matches the top predicted cell type better than the other potential matches.
The reliability of the top predicted cell type can be confirmed based on the additional details provided in the Detailed results, which are accessible for each group via the “Top Hits” button. This table displays the top 10 most similar reference gene lists with associated statistics. The rank-based score quantifies the similarity between the query and reference gene lists, while the false discovery rate (FDR) assesses its significance. This score takes into account the number of genes in the query and reference lists, the overlap between them, and their relative positions. The total number of overlapping genes between the DEG lists of the query and reference is also shown.
In summary, the predicted cell type’s prediction score provides insight into the specificity of the assignment, while the rank-based score reflects the robustness of the match, and the FDR indicates its statistical significance.
How to interpret the results
After carefully examining the predicted cell types and top matching signatures provided by CellKb, users can interpret the results based on the following 3 scenarios:
- A single cell type with a high prediction score, supported by multiple matching reference signatures and with a high rank-based score and a low FDR value.
This indicates a reliable prediction since these criteria suggest a unique and statistically significant similarity between the DEGs in the query and the reference gene lists. Such a result is also indicative of a high quality of cells and a clean separation between cell type groups during the analysis. - Multiple cell types with comparable prediction scores, supported by multiple matching reference signatures and with high rank-based scores and low FDR values.
This outcome indicates that the DEG list for the group either resembles closely related cell types, or contains a mixture of cell types that have not been cleanly separated during clustering. In such cases, users can take the following steps:- Analyze the expression of marker genes from the top matching cell types to identify the dominant cell type.
- Recluster the cell group using more granular parameters to segregate the cell types for better annotation.
- Cell type predicted with a high prediction score, but with a low rank-based score for matching reference signatures and a high FDR value.
This outcome indicates that the expression profile of the query group is not significantly similar to any reference signature in the knowledge base. This could either be because the query group consists of stressed, dead, or contaminated cells, or the query represents a novel cell type that is not present in the knowledge base. In either case, the users can do the following:- Change the knowledge base filters to increase the reference dataset.
- Check the differential expression and perform functional enrichment analysis.
In conclusion, CellKb provides a cell type prediction for the user’s query group based on its similarity to the gene signatures in the reference knowledge base. Based on the scenarios described above, users are encouraged to further examine detailed results to validate the predictions and refine their analysis pipeline as needed.
Upcoming Webinar: How to Easily Perform Effective scRNA-Seq Cell-Type Predictions
February 13th sessions 9:30 and 18:30 CET. Register for free here!

About the Author
 Marta Benegas
 studied biotechnology at the Valencia Polytechnic University (UPV) and continued her studies with a Master's in Bioinformatics at the Autonomous University of Barcelona (UAB), Spain. After her master's degree, she started her professional career at Biobam where she is now working as a bioinformatics specialist and support manager.
At the moment she is mainly focused on Single-Cell technologies developing various pipelines which allow getting from reads to functional insights at a single-cell resolution. These developments are available in OmicsBox, BioBam’s software solution.
Marta Benegas
Marta Benegas studied biotechnology at the Valencia Polytechnic University (UPV) and continued her studies with a Master's in Bioinformatics at the Autonomous University of Barcelona (UAB), Spain. After her master's degree, she started her professional career at Biobam where she is now working as a bioinformatics specialist and support manager.
At the moment she is mainly focused on Single-Cell technologies developing various pipelines which allow getting from reads to functional insights at a single-cell resolution. These developments are available in OmicsBox, BioBam’s software solution.
")


