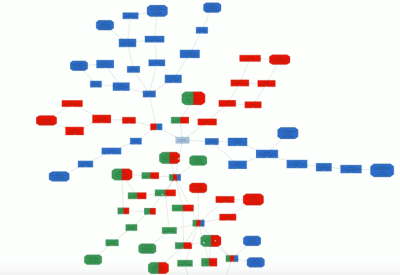
The Coloured Graph option is a function in Blast2GO which allows to combine and visualize multiple functional profiles within one GO graph. For each group or profile a different color can be assigned and the resulting GO graph can be filtered and colored accordingly.
This video shows how to create a text files to generate a Coloured Graph for three different types of pancreatic cancer and how to use the different graph settings to obtain a good visualization.
For more video tutorial have a look at our Video Blog or visit our YouTube channel.


