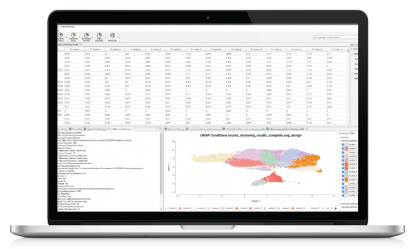
One of the most common applications of RNA-seq is to estimate gene and transcript expression. It starts with the alignment or mapping of reads and there are two possible alternatives: mapping to the genome when a reference sequence is available or mapping to the transcriptome (e.g. de novo assembled transcriptome). Reads may map uniquely or could be multi-mapped reads, while multi-mapped reads arise more often when the reference is the transcriptome because one read could map equally well to all gene isoforms in the transcriptome that share the exon.
After the mapping, the read quantification is performed. The simplest approach to the quantification is to aggregate raw counts of mapped reads using a program such as HTSeq-count or featureCounts. These gene-level quantification approaches use a gene transfer format (GTF or GFF) file containing the genome coordinates of exons and genes and often discard multi-reads.
Several sophisticated algorithms have been developed to estimate transcript-level expression by tackling the problem of related transcripts sharing most of their reads. Algorithms that quantify expression from transcriptome mapping include RSEM (Rna-Seq by Expectation Maximization), eXpress, Sailfish and Kallisto among others. These methods allocate multi-mapping reads among transcript and output within-sample normalized values corrected for sequencing biases.
“The simplest approach to the quantification is to aggregate raw counts of mapped reads using a program such as HTSeq-count or featureCounts”
How to use the Create Count Table functionality of OmicsBox
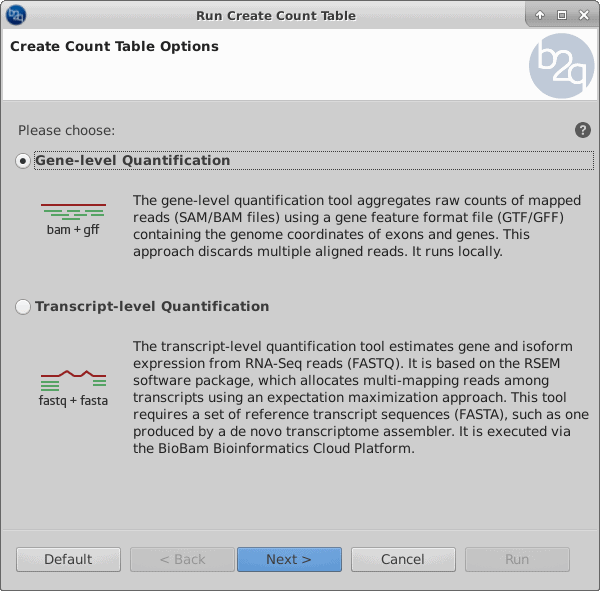
The Create Count Table functionality of OmicsBox is designed to estimate gene expression from RNA-sequencing experiments. It offers two options: the gene-level and the transcript-level quantification approach.
-
- The gene-level is based on the popular HTSeq package and it expects files with aligned reads in SAM/BAM format and a GTF/GFF file with the coordinates of genomic features.
- The transcript-level option is based on RSEM and it expects sequencing reads in FASTQ format and a set of transcript sequences in FASTA format, such as one produced by a de novo transcriptome assembler. This option is appropriate when no reference genome is available.
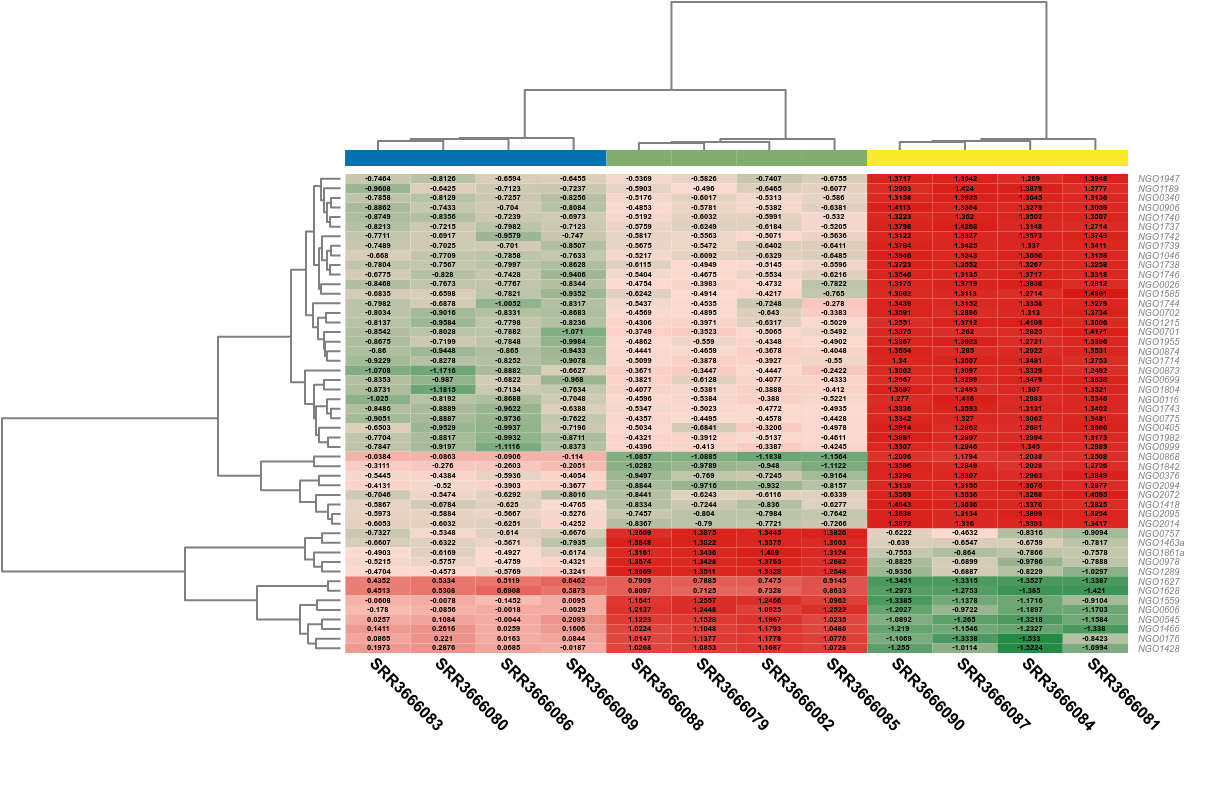
The most common use of gene/transcript expression levels is the search for differentially expressed (DE) genes, that is, genes that show differences in expression level between conditions or are associated with given predictors or responses. Detecting genes that are differentially expressed between conditions is a fundamental part of understanding the molecular basis of phenotypic variation.
“The most common use of gene/transcript expression levels is the search for differentially expressed (DE) genes”
Although RNA-seq offers several advantages over microarrays for differential expression analysis, it has some difficulties inherent to next-generation sequencing. For example, the sequencing depths or library sizes (the total number of mapped reads) are typically different for different samples, which means that the observed counts are not directly comparable between samples. To account for this difficulty and attempt to make the counts comparable across samples, several normalization procedures have been proposed, such as the Weighted Trimmed Mean of M-values (TMM), Relative Log Expression (RLE), Read Per Kilobase per Million mapped reads (RPKM), and Upper-quartile methods.
These procedures include the estimation of sample-specific normalization factors that are used to rescale the observed counts. Furthermore, genes with very low counts across all libraries provide little evidence for differential expression, so they should be filtered out prior to differential expression analysis.
Counts from an RNA-seq experiment are non-negative integers and follow a discrete distribution, so the methods developed for differential expression analysis use the Poisson distribution and the Negative Binomial (NB) distribution models. The estimation of the parameters for the respective statistical model is followed by the test for differential expression, the calculation of the significance of the change in expression of each gene between two conditions (pairwise analysis) or over time. For example, both edgeR and DESeq use a variation of the Fisher exact test adopted for NB distribution and they return exact P values computed from the derived probabilities, while maSigPro uses generalized linear models.
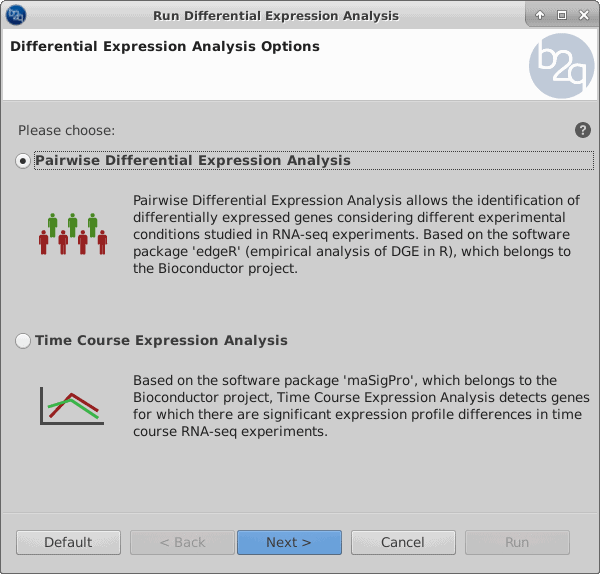
OmicsBox provides two strategies to perform differential expression analysis of RNA-seq data:
-
- The Pairwise Differential Expression Analysis option allows the identification of differentially expressed genes considering the experimental conditions studied, and it is based on the software package edgeR, which belongs to the Bioconductor project.
- The Time Course Expression Analysis option allows detecting genes for which there are significant expression profile differences in time course RNA-seq experiments. They require raw counts as input, offer several filtering and normalization options, and output statistical results as well as visualizations that facilitate the interpretation of results. It is based on the maSigPro Bioconductor package.
If you need further information about how to perform an expression quantification and differential expression analysis with OmicsBox, please consult the user manual or contact us.
