Release OmicsBox version 1.2 (24th of October, 2019)
We are happy to announce the following updates for the Metagenomics Module.
New Metagenomics feature include OTU Differential Abundance Testing and several new taxonomy plots: Chao1 Diversity, Rarefaction Curves and PCoA.
More details can be found below as well as in the online user manual and Metagenomics Module website.
New Taxonomy Statistics and Plots
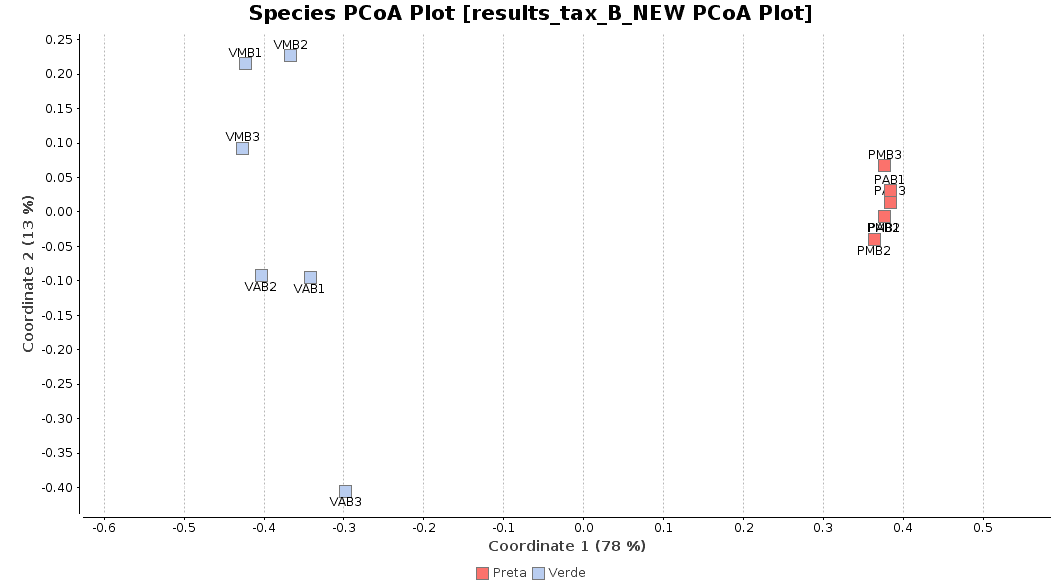
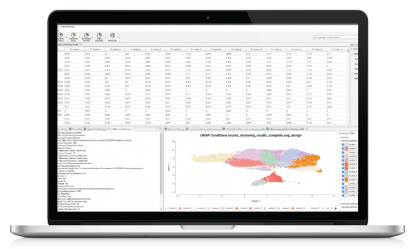
Principle Coordinate Analysis (PCoA) Plot
- Get a first idea of how the samples separate by coordinates
- Possible with and without experimental design
- Available for different taxonomic levels (Species, Genus, Phylum, etc.)
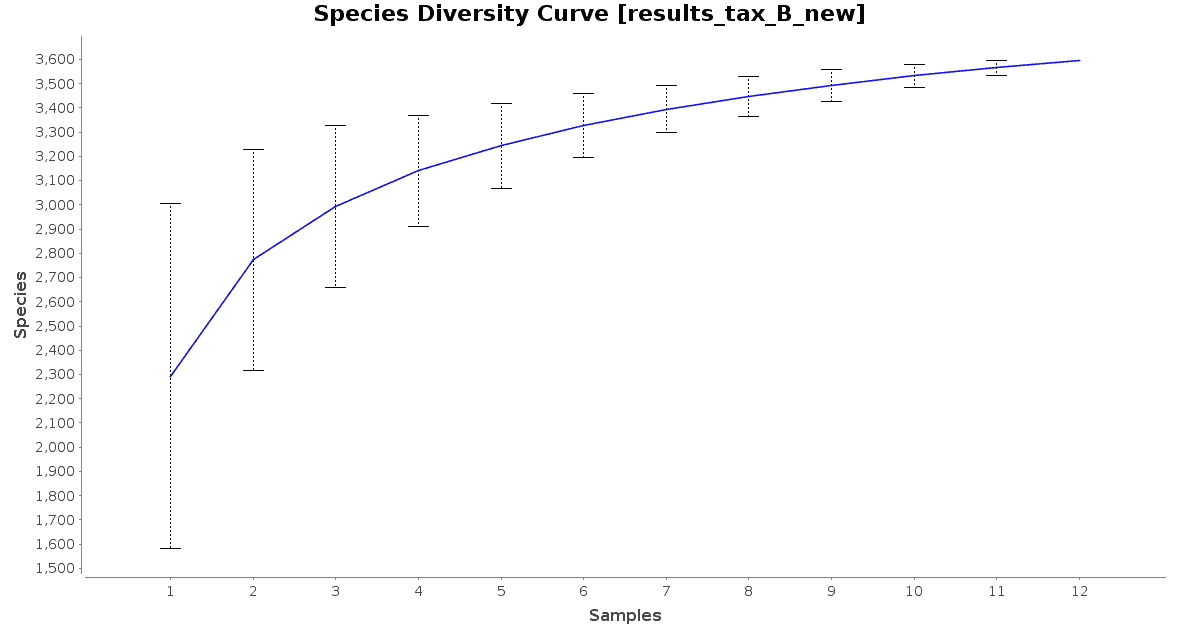
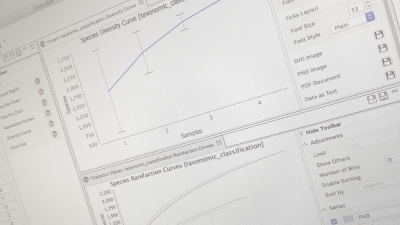
Chao1 Species Diversity Curve
- Evaluate species diversity for the whole dataset
- Available for different taxonomic levels (Species, Genus, Phylum, etc.)
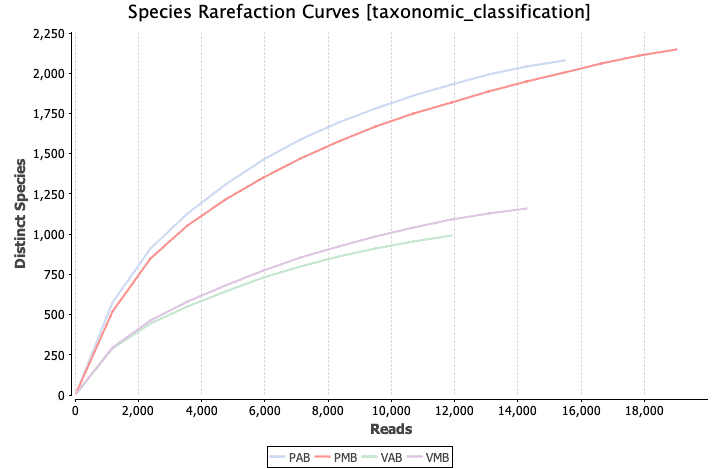
Rarefaction curves
- Check the sequencing depths for all samples
- Available for different taxonomic levels (Species, Genus, Phylum, etc.)
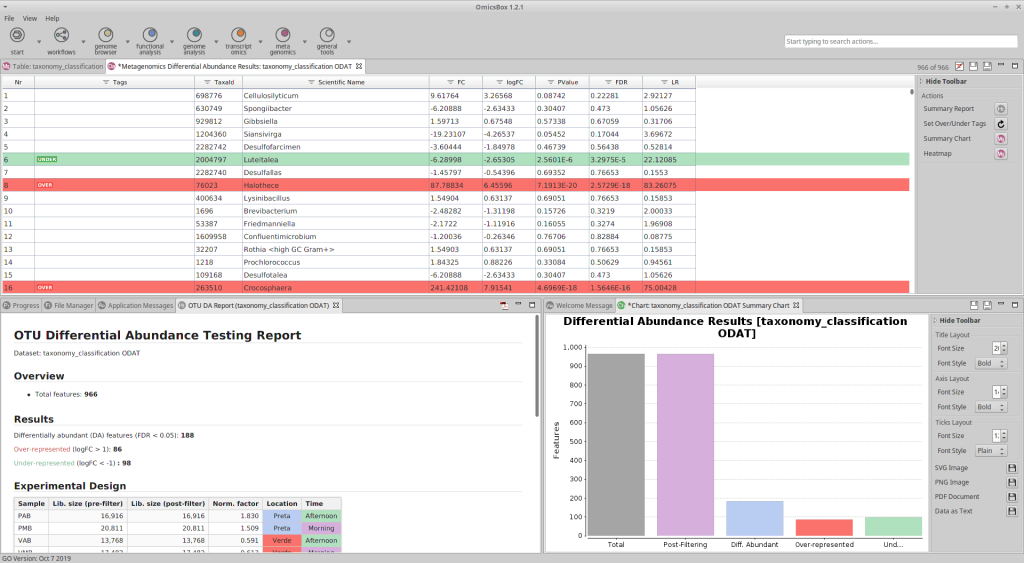
OTU Differential Abundance Testing
This tool identifies Operational Taxonomic Units (OTUs) that significantly differ between 2 microbial communities (groups). It is implemented based on edgeR, which belongs to the Bioconductor project, and implements statistical tests to evaluate the significance of OTU abundances between a contrast and a reference group.
- Easily execute DA-tests with complex group configurations
- PDF Report
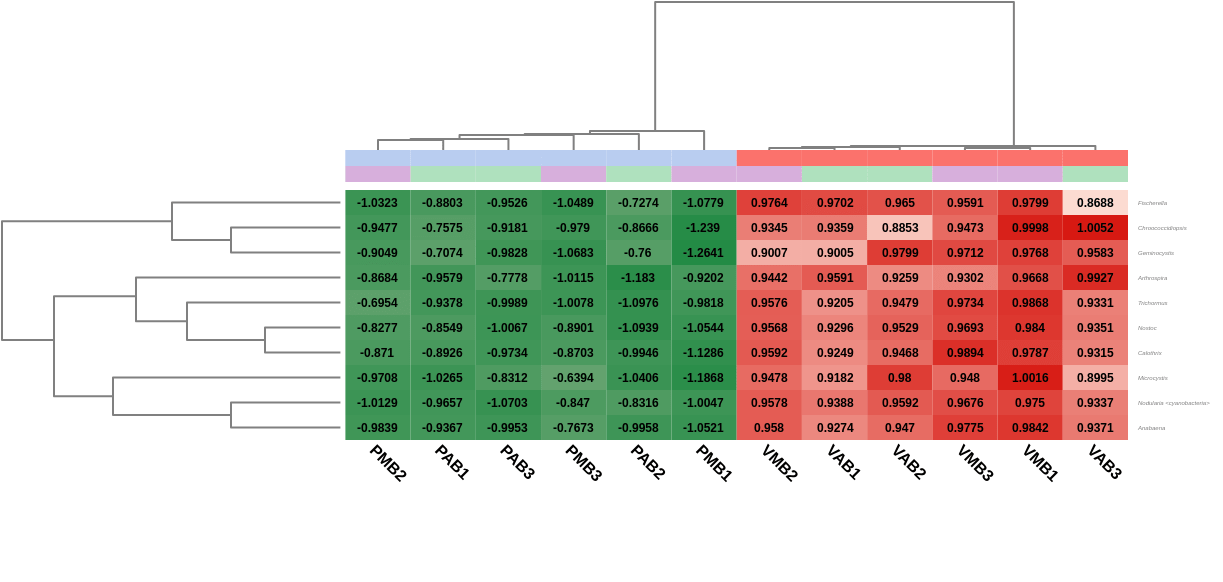
- Heatmap to summarize the results
